SEE STUDY RESULTS

POWERFUL RESULTS WITH KESIMPTA
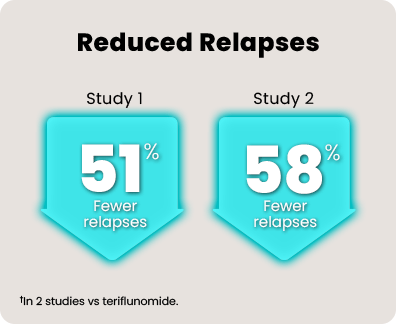
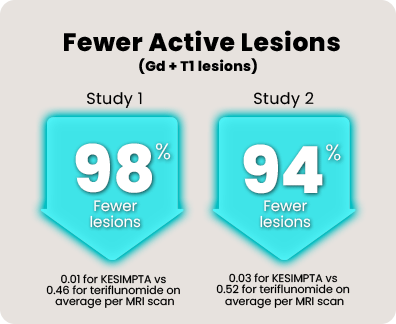
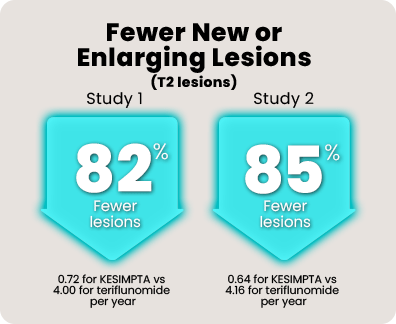
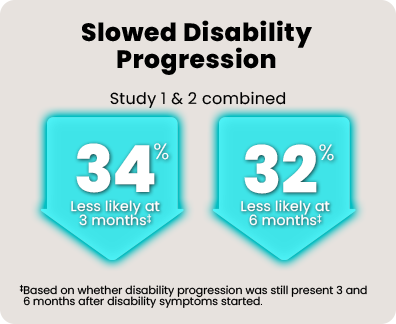
Over 1800 people with relapsing MS participated in 2 head-to-head studies comparing KESIMPTA to teriflunomide.* In the 1 to 2 years leading up to the studies, all of them had experienced a relapse or saw activity on an MRI scan.

PROVEN SUPERIOR†

MAGGIE S.
Mom, Recent Grad
Switched to KESIMPTA: 2021
“Since starting KESIMPTA, I’ve had fewer relapses, which is really cool. I love seeing that it’s really working for me.”
Want more info to help you decide?
Find out why so many people are choosing KESIMPTA.
Want co-pay help?
97% of all prescriptions filled have a $0 out of pocket cost when used with the Access Card.§¶
Unless otherwise indicated, everyone featured on this webpage lives with relapsing MS, has taken KESIMPTA, and has been compensated for their time.
MS, multiple sclerosis; RMS, relapsing multiple sclerosis.
§Limitations apply. Offer not valid under Medicare, Medicaid, or any other federal or state health insurance program. Patients with commercial insurance who are initially denied coverage may receive free KESIMPTA for up to 12 months while seeking coverage. Patients with commercial insurance who have coverage for KESIMPTA may receive up to $18,000 in annual co-pay benefits. Novartis reserves the right to rescind, revoke, or amend this program without notice. Additional limitations may apply. See complete Terms & Conditions at start.kesimpta.com.
¶2024 data on file.


